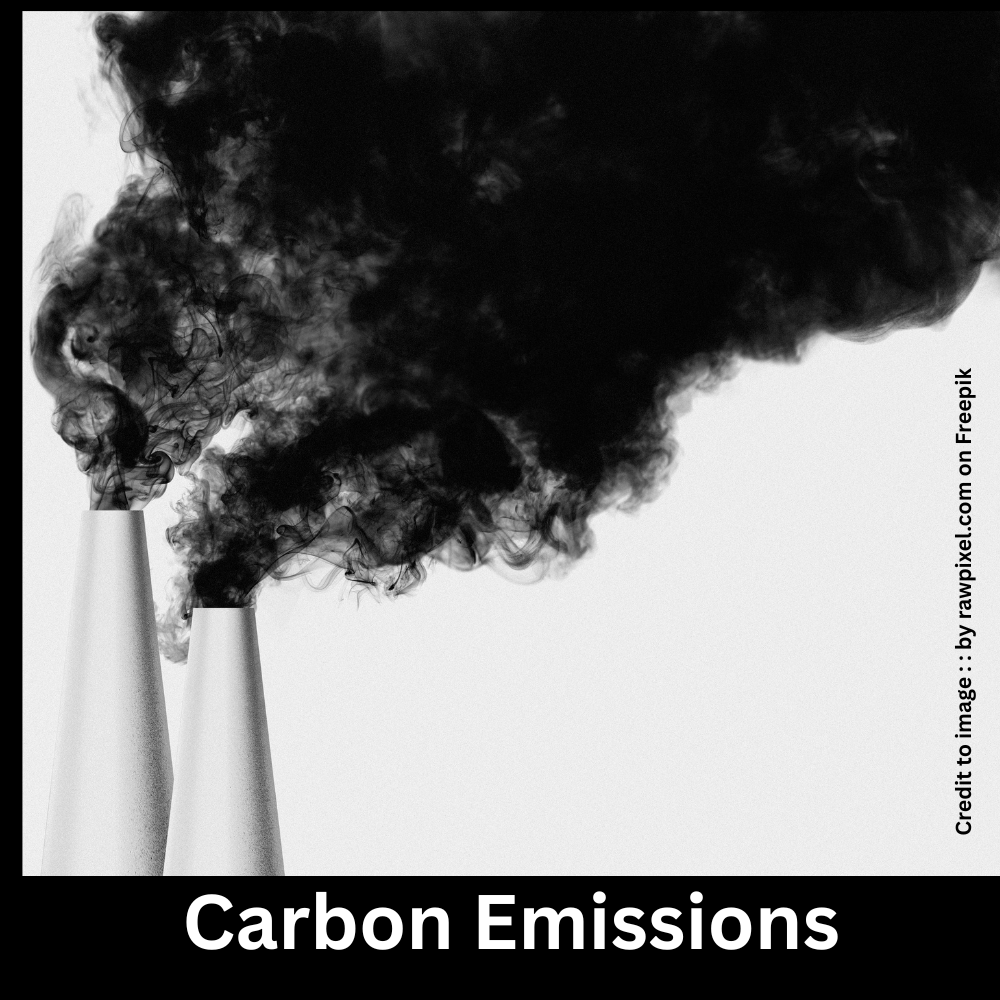
Carbon emissions—primarily carbon dioxide (CO₂) from fossil fuels and industry—hit new highs even as clean energy grows. Global energy-related CO₂ reached ~37.4 Gt in 2023 (+1.1% year-on-year), and scientific assessments project another small increase in 2024, underscoring the urgency to cut emissions this decade. The latest UNEP Emissions Gap Report 2024 says global GHGs must fall ~42% by 2030 (vs. current policies) to align with 1.5 °C. This article explains what “carbon emissions” are, why they matter, where they come from (by sector and country), who the top emitters are, and which policy and technology levers can deliver near-term cuts. It includes current, citable data tables and a practical FAQ for students, policymakers, and sustainability professionals.
Table of Contents
- What do we mean by “carbon emissions”?
- Why CO₂ dominates climate change
- Global trend (2019–2024): Are emissions still rising?
- Sources by sector (electricity, industry, transport, AFOLU, buildings)
- Top 10 emitting countries (2023)
- Per-capita vs. total emissions: why both matter
- Carbon intensity of growth (decoupling GDP and CO₂)
- Policies that work: carbon pricing, standards, and finance
- Technologies at scale in the 2020s
- India and the United States: contrasts and convergence
- Corporate action, MRV, and Scope 1–3 basics
- What will it take to close the 2030 “emissions gap”?
- Summary
- Conclusion
- FAQs (15)
- References
1) What do we mean by “carbon emissions”?
In climate discussions, “carbon emissions” typically refers to CO₂ released by burning coal, oil, and gas and by industrial processes (e.g., cement). Many datasets report energy-related CO₂ only, while others include land-use change (deforestation) or non-CO₂ gases (CH₄, N₂O) expressed as CO₂-equivalent. Always check scope when comparing numbers. Authoritative series include the Global Carbon Budget, IEA energy-related CO₂, EDGAR (EU JRC), and Our World in Data synthesis.
2) Why CO₂ dominates climate change
CO₂ accounts for the largest share of long-lived GHG forcing due to the scale of fossil fuel use and the gas’s long atmospheric lifetime. That’s why most net-zero pathways track CO₂ separately (and first). The Global Carbon Budget 2024 also reports atmospheric CO₂ averages >422 ppm—about 52% above pre-industrial levels.
3) Global trend (2019–2024): Are Carbon Emissions still rising?
Table A. Global energy-related CO₂ emissions (GtCO₂)
(IEA actuals to 2023; 2024 uses Global Carbon Budget 2024 projection)
| Year | Global CO₂ (Gt) | Notes |
| 2019 | ~36.7 | Pre-pandemic level |
| 2020 | ~34.8 | Covid-19 shock |
| 2021 | ~36.3 | Rebound |
| 2022 | ~37.0 | New high |
| 2023 | ~37.4 | +1.1% YoY; drought-hit hydro added ~170 Mt |
| 2024 (proj.) | ~37.7 | ~+0.8% vs 2023 (fossil CO₂) |
Sources: IEA CO₂ Emissions in 2023 (actuals and diagnostics); Global Carbon Budget 2024 (ESSD) / CarbonBrief analysis for 2024 projection. Takeaway: Clean energy growth is slowing emissions growth, but demand, drought-related hydro shortfalls, and coal use in some regions kept totals rising. Advanced economies cut emissions in 2023; increases were concentrated elsewhere.
4) Sources by sector (electricity, industry, transport, AFOLU, buildings)
Table B. Approximate global GHG emissions by sector (latest syntheses)
| Sector (GHG scope) | Share of global GHGs* |
| Electricity & Heat | ~34% |
| Industry (incl. cement/chemicals) | ~24% |
| AFOLU (agriculture, forestry, land use) | ~18% |
| Transport (road, aviation, shipping) | ~16% |
| Buildings (direct fuel use) | ~6% |
| Other | ~2% |
*Ranges vary by methodology; figures aggregated from OWID sector analysis and IPCC/IEA sources referenced there. Implication: Power decarbonization plus electrification of end-uses (vehicles, heat pumps) and deforestation reduction deliver the largest near-term gains.
5) Top 10 emitting countries (2023)
Table C. Top 10 countries by CO₂ emissions (2023, MtCO₂)
(EDGAR 2023; values rounded; EU shown separately in EDGAR but omitted here to keep “country only” ranking)
| Rank | Country | CO₂ (Mt) |
| 1 | China | 13,260 |
| 2 | United States | 4,682 |
| 3 | India | 2,955 |
| 4 | Russia | 2,070 |
| 5 | Japan | 945 |
| 6 | Iran | 779 |
| 7 | Indonesia | 675 |
| 8 | Saudi Arabia | 623 |
| 9 | Germany | 583 |
| 10 | Canada | 575 |
Source: EDGAR (EU JRC) 2024 update, 2023 country totals (as compiled in public tables that draw from EDGAR). Note: Datasets differ slightly (e.g., territorial CO₂ vs. consumption-based CO₂; inclusion/exclusion of land-use change). Our World in Data’s carbon series (sourced from the Global Carbon Budget 2024) provides consistent territorial CO₂ to 2023.
6) Per-capita vs. total emissions: why both matter
Large economies dominate totals, but per-capita emissions reveal equity and responsibility questions. High per-capita levels in some producers/exporters contrast with lower per-capita levels in populous developing economies. See OWID’s per-capita dashboards for country-by-country time series.
7) Carbon intensity of growth (decoupling GDP and CO₂)
According to the IEA, global CO₂ emissions in 2023 grew at a slower pace than the world’s GDP, suggesting a gradual structural shift driven by the expansion of renewables, increased use of electric vehicles, improved energy efficiency, and—depending on the region—a transition from coal to natural gas. However, absolute cuts—not just slower growth—are needed to meet 1.5 °C/2 °C goals.
8) Policies that work: carbon pricing, standards, and finance
- Strong 2030 NDCs & Net-Zero Laws: The 2024 UNEP Gap shows a 42% cut by 2030 is needed to align with 1.5 °C—implying stronger NDCs due in 2025 (pre-COP30).
- Carbon pricing + performance standards: Complementary tools (e.g., zero-emission vehicle mandates, clean-power standards) drive deployment where pricing alone is slow.
- Public and blended finance for emerging economies: Closing cost of capital gaps accelerates clean energy in the power and industrial base.
9) Technologies at scale in the 2020s
- Clean electricity: Solar, wind, storage, grids; fix hydro-climate exposure.
- Electrification: EVs, heat pumps, induction, e-boilers.
- Industry: Efficiency; clinker substitution; CCS in cement/steel; green hydrogen for high-temperature heat and DRI.
- Methane abatement: Oil & gas leak detection/repair and agriculture measures (fast, cheap climate wins).
- Nature & land use: End deforestation; re/afforestation; soil carbon—high impact but must be additional and durable.
10) India and the United States: Differences and Common Ground
- United States: Emissions fell in 2023 despite growth, driven by coal-to-clean power shift and efficiency; per-capita remains high. India: Rapid demand growth increased totals; per-capita remains well below OECD averages; major room for low-cost renewables, grid upgrades, and industrial efficiency.
11) Corporate action, MRV, and Scope 1–3 basics
- Scope 1: Direct (on-site fuel/process).
- Scope 2: Purchased electricity/heat.
- Scope 3: Value-chain (often >70% of total).
Disclosure is expanding via ISSB/GRI frameworks; firms should align targets with 1.5 °C-consistent decarbonization pathways and prioritize real reductions before offsets.
12) What will it take to close the 2030 “emissions gap”?
UNEP: New NDCs due in early 2025 must collectively lift ambition; otherwise the world remains on a ~2.5–2.9 °C track. Deep near-term actions include coal phase-down, halting deforestation, methane abatement, and scaling clean industry.
13) Summary
- Record highs: Global energy-related CO₂ reached ~37.4 Gt (2023); modest rise projected in 2024.
- Where it comes from: Power and heat (~34%), industry (~24%), AFOLU (~18%), transport (~16%).
- Who emits most: China, U.S., India, Russia, Japan, Iran, Indonesia, Saudi Arabia, Germany, Canada (2023).
- UNEP stresses that achieving the 1.5 °C goal will require cutting global emissions by about 42% by 2030, which calls for rapid expansion of clean energy, widespread electrification, deep industrial decarbonization, stronger land conservation, and swift action to reduce methane emissions.
14) Conclusion
The world is decarbonizing—but too slowly. Clean energy has bent the curve, yet absolute emissions are still edging up. A decisive 2025–2030 push—anchored in strong NDCs, robust policy mixes, and scaled finance—can turn the corner. Every tonne avoided lowers risks, buys time for adaptation, and saves lives.
FAQs (15 quick answers)
- What are the main sources of carbon emissions?
Electricity & heat (power generation), industry (incl. cement), transport, agriculture/land use, and buildings. - Are global CO₂ emissions still rising?
Yes—2023 hit ~37.4 Gt (+1.1% YoY), with a small rise projected for 2024. - Which country emits the most CO₂ today?
China, followed by the U.S. and India (2023). - Why did emissions rise in 2023 despite clean energy growth?
Drought cut hydropower, boosting fossil generation; demand growth in some regions; coal use in power and industry. - What cut is needed by 2030 for 1.5 °C?
~42% below current-policy trajectories by 2030; ~57% by 2035. - Do these figures include deforestation?
Often no. Energy-related CO₂ excludes land-use change; Global Carbon Budget publishes separate totals. - Is the EU a “country” in rankings?
No—some lists show EU-27 as a bloc; strict “country-only” lists exclude it. - Why does per-capita matter?
It reflects average lifestyle/production intensity and informs fair-share debates.
FAQs (15 quick answers)
- What is the “carbon budget”?
The remaining cumulative CO₂ that can be emitted for a given warming limit. Recent work indicates the 1.5 °C budget is small and shrinking fast. - Which policies work fastest?
Clean-power standards, coal retirements, methane rules, EV/efficiency mandates, plus carbon pricing and targeted finance. - What role does public opinion play?
UNDP’s 2024 People’s Climate Vote shows broad support for stronger climate action across countries. - Is CCS necessary?
In hard-to-abate sectors (cement, some chemicals), most 1.5/2 °C pathways include some CCS alongside material substitution and efficiency. - Are offsets enough?
No. Prioritize real, near-term reductions; use high-quality, additional, durable removals only as a complement. - How can companies measure emissions?
Follow the GHG Protocol to measure Scope 1–3 emissions, verify the data through audits, and report it in line with ISSB or GRI standards, ensuring that all targets are consistent with science-based climate pathways. - What about developing economies’ growth needs?
Finance and technology transfer are key so growth is met with clean energy; advanced economies must cut faster and fund transitions. UNEP & IEA stress scaling clean investment in emerging markets.
References (authoritative & citable)
- IEA (2024). CO₂ Emissions in 2023 (report + executive summary). International Energy Agency. (IEA, IEA Blob Storage)
- Friedlingstein, P. et al. (2025). Global Carbon Budget 2024. Earth System Science Data 17, 965–, Copernicus/ESSD. (Includes 2024 projections; basis for OWID 2023 data.) (ESSD)
- Our World in Data (2024). Annual CO₂ emissions dataset (GCP-sourced); CO₂ & Greenhouse Gas Emissions topic pages; Emissions by sector. (Our World in Data)
- UNEP (2024). Emissions Gap Report 2024. United Nations Environment Programme. (UNEP – UN Environment Programme)
- UNDP (2024). People’s Climate Vote 2024 (Climate Promise). United Nations Development Programme. (UNDP Climate Promise)
- EDGAR (2024). GHG emissions of all world countries – 2024 Report. European Commission, JRC. (Country-level CO₂ tables for 2023; widely re-published.) (edgar.jrc.ec.europa.eu)
Abbreviation List :
Here’s the Abbreviation List with full forms used in the above article on Carbon Emissions:
| Abbreviation | Full Form |
| AFOLU | Agriculture, Forestry and Other Land Use |
| CCS | Carbon Capture and Storage |
| CH₄ | Methane |
| CO₂ | Carbon Dioxide |
| COP | Conference of the Parties (to the UNFCCC) |
| DRI | Direct Reduced Iron |
| EDGAR | Emissions Database for Global Atmospheric Research |
| ESSD | Earth System Science Data (journal) |
| EV | Electric Vehicle |
| GDP | Gross Domestic Product |
| GHG | Greenhouse Gas |
| GRI | Global Reporting Initiative |
| GtCO₂ | Gigatonnes of Carbon Dioxide |
| IEA | International Energy Agency |
| IPCC | Intergovernmental Panel on Climate Change |
| ISSB | International Sustainability Standards Board |
| JRC | Joint Research Centre (European Commission) |
| MtCO₂ | Million Tonnes of Carbon Dioxide |
| NDC | Nationally Determined Contribution |
| OECD | Organisation for Economic Co-operation and Development |
| OWID | Our World in Data |
| ppm | Parts Per Million |
| SDGs | Sustainable Development Goals |
| UN | United Nations |
| UNDP | United Nations Development Programme |
| UNEP | United Nations Environment Programme |
| UNFCCC | United Nations Framework Convention on Climate Change |
| YoY | Year-on-Year |
Call for Papers – Special Offer for Early Contributors
Prakriti Darshan – International Journal of Environment Science and Multidisciplinary Studies
🌐 Visit Website
PRAKRITI DARSHAN-NATURE AND ENVIRONMENT MAGAZINE
” Prakriti Darshan” is a leading Hindi-language magazine and digital platform dedicated to raising public awareness on vital issues related to nature, biodiversity, climate change, sustainable development, and environmental conservation. This magazine represents a unique blend of science, society, and sensitivity—offering a common platform for researchers, students, NGOs, policymakers, nature lovers, and conscious citizens alike.
With thought-provoking articles, inspiring stories, environmental research, impactful projects, and policy perspectives, Prakriti Darshan is a transformative journey toward a greener and more sustainable future.
Let us come together to protect and preserve our planet for generations to come. 🌿🌍
Join us in our mission to protect and celebrate the planet. 🌏💚
Click for more information
- Visit www.prakritidarshan.com for Free Magazine ,Free membership benefits ,offered price magazine @ Rs.1 or Rs.11 only and more ……
- 🎗️Sponsor Prakriti Darshan Magazine – Support our environment mission.
- 📚 Explore the Environment Magazine – Read our latest and past issues.
- ✍️ Read Editor’s Article or Blog – Insightful thoughts from our editorial desk.
- 🌱 Join Membership – Be part of India’s leading green community.
- 🤝 Become an NGO Impact Story Partner – Share your grassroots impact nationwide.
- 🏢 Become a Company Partner – Showcase your CSR, ESG, or sustainability work.
- 👤 Become an Individual Partner – Volunteer, write, and raise your green voice.
- 📢 Advertise with Us – Reach eco-conscious readers across India.
- Eco Trails Newsletter
- Donate for “Hari Ho Vashundhara & Har school Hariyali “ Plantation campaign Associated Partner NGO :GDSS NGO www.gdssngo.org
BALA DATT SHARMA,
MANAGING EDITOR ,
PRAKRITI DARSHAN-NATURE AND ENVIRONMENT MAGAZINE
- Drake Passage: The World’s Roughest Sea Route Between Atlantic and Pacific Oceans - August 22, 2025
- Top 10 Natural Parks in the USA: Biodiversity, Geography & Global Relevance - August 21, 2025
- Exploring the Best Natural Parks in USA: Biodiversity, Sustainable Tourism, and Role in SDGs - August 21, 2025